Write basics of R
Measures of Central Tendency
x=c(1,2,3,4,5,6)
sum(x)
mean(x)
median(x)
sqrt(x)
x^2
seq(1,9)
Output
> source("~/Documents/Github/rfiles/exp_1/main.R", echo=TRUE)

> x=c(1,2,3,4,5,6)

> sum(x)
[1] 21

> mean(x)
[1] 3.5

> median(x)
[1] 3.5

> sqrt(x)
[1] 1.000000 1.414214 1.732051 2.000000 2.236068
[6] 2.449490

> x^2
[1]  1  4  9 16 25 36

> seq(1,9)
[1] 1 2 3 4 5 6 7 8 9
note
To compile and run the program, press Ctrl+Alt+Enter.
Data Frames
mock_data <- data.frame(
  Name = c("Alice", "Bob", "Charlie", "David", "Eva"),
  Age = c(25, 30, 35, 40, 28),
  Score = c(88.5, 92.0, 75.5, 85.0, 90.0),
  Passed = c(TRUE, TRUE, FALSE, TRUE, TRUE)
)
print(mock_data)
summary(mock_data)
Output
> source("~/Documents/Github/rfiles/exp_1/dataframe.R", echo=TRUE)

> mock_data <- data.frame(
+   Name = c("Alice", "Bob", "Charlie", "David", "Eva"),
+   Age = c(25, 30, 35, 40, 28),
+   Score = c(88.5, 92.0, 75.5, 8 .... [TRUNCATED]

> print(mock_data)
     Name Age Score Passed
1   Alice  25  88.5   TRUE
2     Bob  30  92.0   TRUE
3 Charlie  35  75.5  FALSE
4   David  40  85.0   TRUE
5     Eva  28  90.0   TRUE

> summary(mock_data)
     Name                Age           Score
 Length:5           Min.   :25.0   Min.   :75.5
 Class :character   1st Qu.:28.0   1st Qu.:85.0
 Mode  :character   Median :30.0   Median :88.5
                    Mean   :31.6   Mean   :86.2
                    3rd Qu.:35.0   3rd Qu.:90.0
                    Max.   :40.0   Max.   :92.0
   Passed
 Mode :logical
 FALSE:1
 TRUE :4
read data from file
text <- readLines(file.choose())
Output
> source("~/Documents/Github/rfiles/exp_1/fileReader.R", echo=TRUE)

> text <- readLines(file.choose())
Warning message:
In readLines(file.choose()) :
  incomplete final line found on '/Users/tejas/Documents/Github/rfiles/exp_1/test-text.txt'
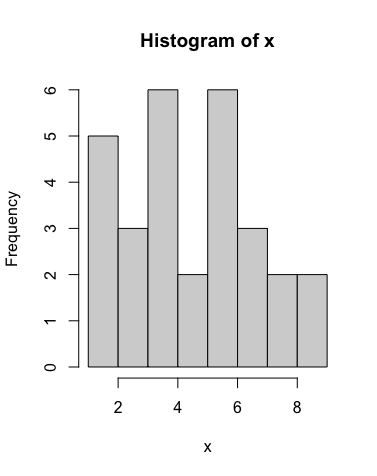
Histogram
x= c(2,4,4,6,6,5,5,7,3,7,3,8,9,7,9,6,4,3,4,4,6,2,2,1,2,4,6,6,8)
hist(x)
Output
Regular Expression
grep("(ab)$",c("aabaa","abaaabab","bab"),value=TRUE)
Output
> source("~/Documents/Github/rfiles/exp_1/regex.R", echo=TRUE)

> grep("(ab)$",c("aabaa","abaaabab","bab"),value=TRUE)
[1] "abaaabab" "bab"
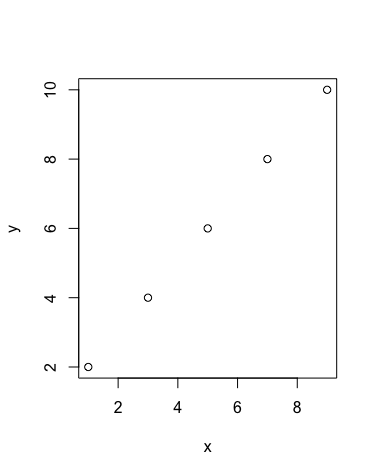
Scatter Plot
x=c(1,3,5,7,9)
y=c(2,4,6,8,10)
plot(x,y)
Output