Download CSVBasic Operations on Small Images using MATLAB
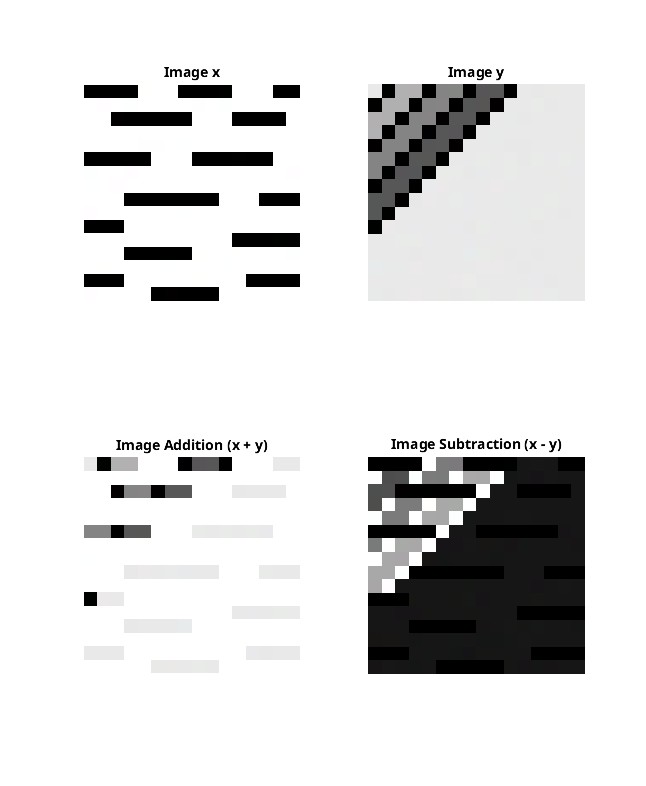
Addition and Subtraction of Images
clc
set(0, 'DefaultFigureRenderer', 'painters')
% IGNORE TILL HERE (ONLY FOR UBUNTU)

% Save subplot in variable
h = figure;
x = imread('Documents/MATLAB/pix1.png')
y = imread('Documents/MATLAB/pix4.png')
% Top left: Original Image x
subplot(2,2,1);
imshow(x);
title('Image x');

% Top right: Original Image y
subplot(2,2,2);
imshow(y);
title('Image y');

% Bottom left: Image Addition
subplot(2,2,3);
a = imadd(x,y);
imshow(a);
title('Image Addition (x + y)');

% Bottom right: Image Subtraction
subplot(2,2,4);
b = imsubtract(x,y);
imshow(b);
title('Image Subtraction (x - y)');

% Save figure to variable h
Output

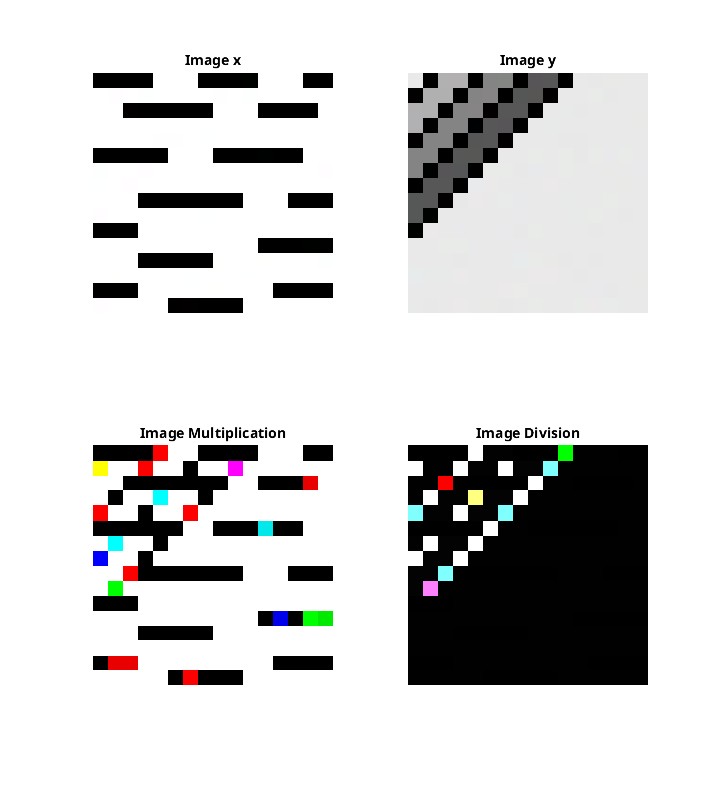
Image Multiplication and Division
% Image Multiplication and Division Script
set(0, 'DefaultFigureRenderer', 'painters')
% IGNORE TILL HERE (ONLY FOR UBUNTU)

% Read images
x = imread('pix1.png');
y = imread('pix4.png');

% Create figure with subplots
h = figure;

% Top left: Original Image x
subplot(2,2,1);
imshow(x);
title('Image x');

% Top right: Original Image y
subplot(2,2,2);
imshow(y);
title('Image y');

% Bottom left: Image Multiplication
subplot(2,2,3);
c = immultiply(x, y);
imshow(c);
title('Image Multiplication');

% Bottom right: Image Division
subplot(2,2,4);
d = imdivide(x, y);
imshow(d);
title('Image Division');
Output

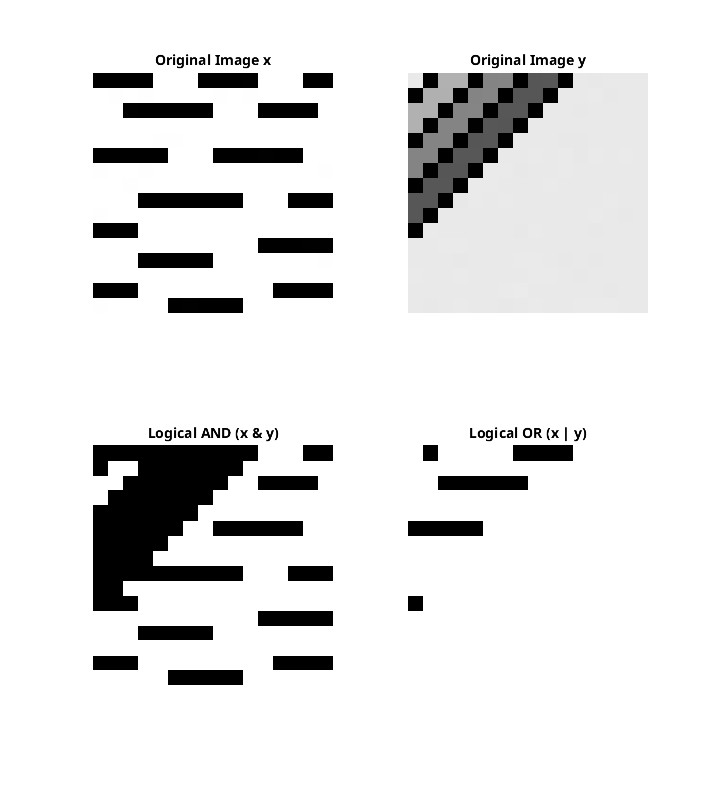
Image Boolean Operations
clc
clear all
close all
set(0, 'DefaultFigureRenderer', 'painters')
% IGNORE TILL HERE (ONLY FOR UBUNTU)

% Load Images
x_path = 'Documents/MATLAB/pix1.png';
y_path = 'Documents/MATLAB/pix4.png';

% Read images
x = imread(x_path);
y = imread(y_path);

% Ensure consistent image processing
if size(x) ~= size(y)
    y = imresize(y, size(x));
end

% Convert to grayscale if color images
if size(x, 3) > 1
    x = rgb2gray(x);
    y = rgb2gray(y);
end

% Normalize images to binary
x_binary = imbinarize(x);
y_binary = imbinarize(y);

% Create visualization figure
h = figure('Name', 'Image Logical Operations', 'NumberTitle', 'off');

% Original Images
subplot(2,2,1);
imshow(x);
title('Original Image x');

subplot(2,2,2);
imshow(y);
title('Original Image y');

% Logical Operations
subplot(2,2,3);
and_result = x_binary & y_binary;
imshow(and_result);
title('Logical AND (x & y)');

subplot(2,2,4);
or_result = x_binary | y_binary;
imshow(or_result);
title('Logical OR (x | y)');

% Adjust figure properties
set(h, 'Position', [100, 100, 1000, 800]);
Output

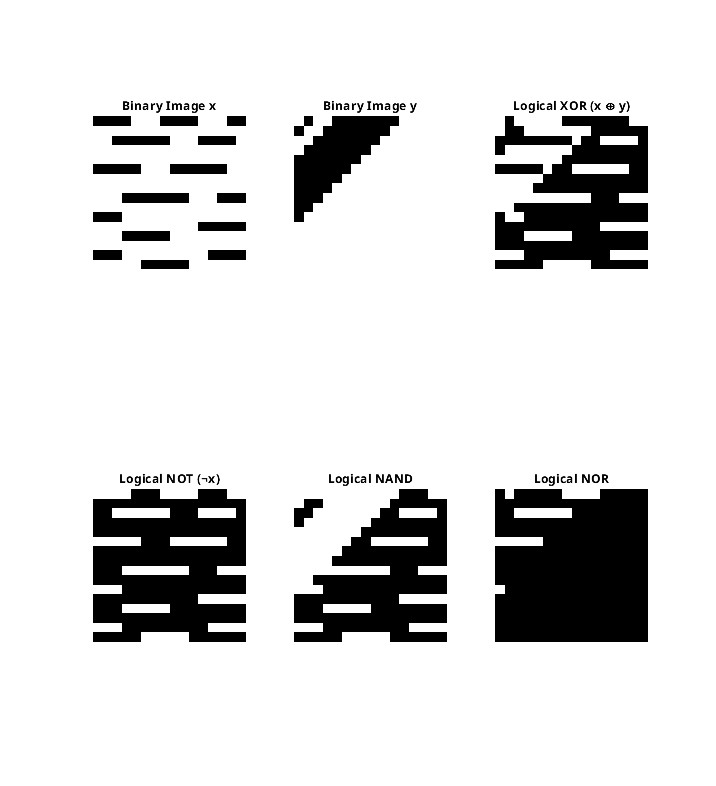
More boolean operations
clc
clear all
close all
set(0, 'DefaultFigureRenderer', 'painters')
% IGNORE TILL HERE (ONLY FOR UBUNTU)

% Load Images
x_path = 'Documents/MATLAB/pix1.png';
y_path = 'Documents/MATLAB/pix4.png';

% Read images
x = imread(x_path);
y = imread(y_path);

% Ensure consistent image processing
if size(x) ~= size(y)
    y = imresize(y, size(x));
end

% Convert to grayscale if color images
if size(x, 3) > 1
    x = rgb2gray(x);
    y = rgb2gray(y);
end

% Normalize images to binary
x_binary = imbinarize(x);
y_binary = imbinarize(y);

% Create visualization figure
h = figure('Name', 'Advanced Binary Image Operations', 'NumberTitle', 'off');

% Original Images
subplot(2,3,1);
imshow(x_binary);
title('Binary Image x');

subplot(2,3,2);
imshow(y_binary);
title('Binary Image y');

% Advanced Binary Operators
subplot(2,3,3);
xor_result = xor(x_binary, y_binary);
imshow(xor_result);
title('Logical XOR (x ⊕ y)');

subplot(2,3,4);
not_x = ~x_binary;
imshow(not_x);
title('Logical NOT (¬x)');

subplot(2,3,5);
nand_result = ~(x_binary & y_binary);
imshow(nand_result);
title('Logical NAND');

subplot(2,3,6);
nor_result = ~(x_binary | y_binary);
imshow(nor_result);
title('Logical NOR');

% Adjust figure properties
set(h, 'Position', [100, 100, 1200, 800]);
Output

